About OVVO Labs
Most quantitative finance tools are built by wrapping a standard model in software. This one wasn’t. Over fifteen years, a single objection — that finance treats good and bad volatility as the same thing — grew into a general statistical framework that the Nobel laureate who created modern portfolio theory called more general than his own, developed alongside collaborators whose work traces through Bell Labs and the foundations of modern statistics. The tools on this site are the applied edge of that work. The story below is why they aren’t something a weekend and an AI can reproduce.
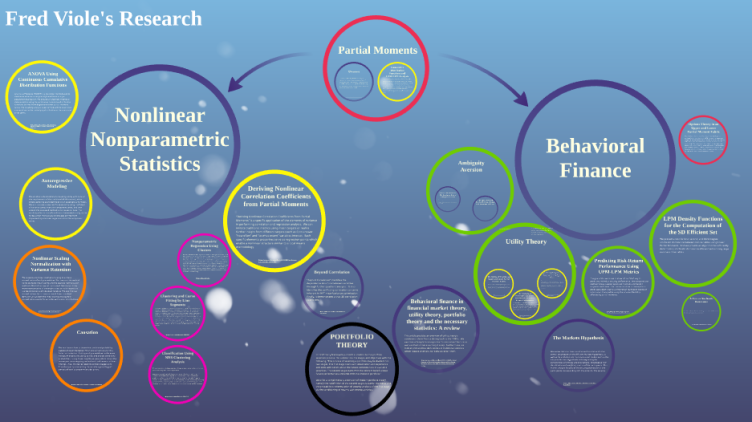
OVVO Labs is the applied expression of a research path that began with a simple frustration: traditional finance was not differentiating between positive and negative variance in any meaningful way. What followed was not a tweak to an existing model, but a broader framework built on partial moments, utility theory, co-partial moments, nonlinear dependence, and nonlinear nonparametric statistics.
Prefer to watch instead of read? Watch our interview
“Your Sharpe ratio is too low.” This was the comment I received from a hiring manager at a very large quantitative hedge fund. It was followed by, “If you give us the code, we can help you make it better.” This did not sit well with me because I had a very positively skewed return structure. Clearly, the hiring manager was not differentiating between positive and negative variance, and also trying to get something for nothing.
My thoughts immediately turned to constructing a more relevant metric than the Sharpe ratio. I reached out to my old professor with an idea of differentiating between the two types of variance, who promptly told me I was describing partial moments and that he had been working with them for the last 25 years. When David Nawrocki showed me the partial moment formulas on the blackboard, it all just clicked.
Utility Theory
My idea to replace the Sharpe ratio was initially met with enthusiasm, however, it was quickly pointed out that it lacked utility theory support. So the new risk metric was put on hold while I started reading deeply into utility theory. Upon learning beyond my initial introduction years earlier, neither expected utility theory nor prospect theory gave me the real “a-ha” moment. Looking across the utility functions in the literature, the link to partial moments became increasingly apparent. Fortunately, there was already some literature on the use of partial moments in utility theory.
Expanding on prior work by Fishburn, Kochenberger, and Holthausen, David and I developed partial moment equivalences to known utility functions in the literature. We wrote several papers on the topic, extending the argument normatively, descriptively, and then testing it. At that point I took the liberty of sending the work to Harry Markowitz, because his earlier writing on utility and portfolio theory resonated with what I was trying to build.
To my utter surprise and delight, Harry responded — and what followed became a multi-year correspondence I am still learning from today. The relationship ran deep enough that in 2013 he wrote a letter of recommendation on my behalf to Goldman Sachs, rooted in the very utility-function questions this work is built on.
I agree that your approach is more general than old-fashioned mean variance… I wish you the best in getting your ideas out.
Harry Markowitz
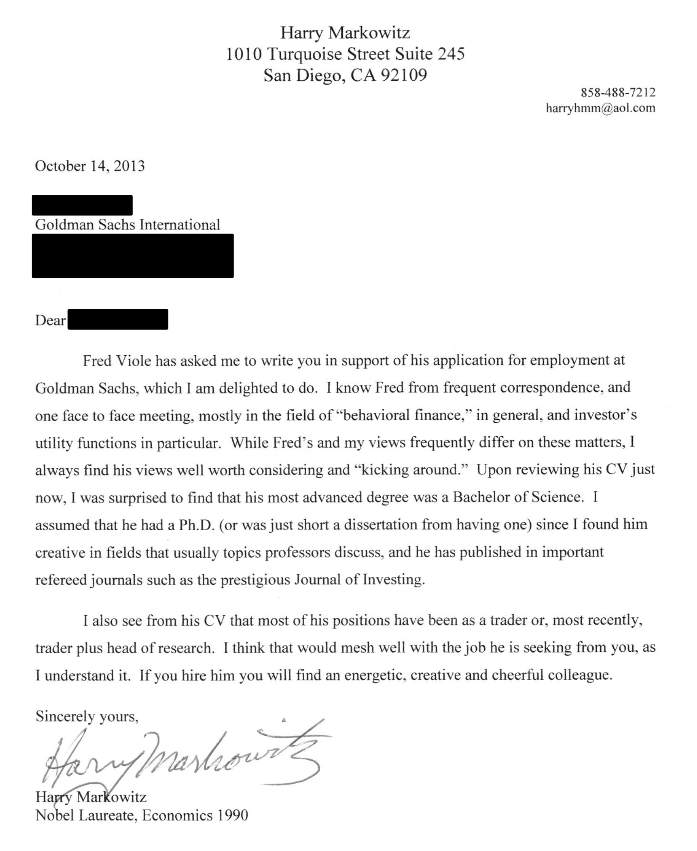
Roughly three years after that letter, his challenges having sharpened the work, he told me plainly that I had demonstrated a general portfolio theory of which mean-variance is a subset. That was not a casual compliment — it was confirmation that the work was operating at the level of foundations, not model adjustments.
Risk Metric
Armed with utility theory support, David and I ran numerous tests of the risk metric using partial moments. It worked — and it worked across different utility functions. With the ubiquity of partial moments in utility theory and the successful Sharpe-ratio-replacing result, thoughts turned to other utility theory representations or proxies. Stochastic dominance fit the bill, and we eventually showed the partial moment equivalence in tests of stochastic dominance as well as extracting the stochastic-dominant efficient set of securities for a given degree.
Co-Partial Moments
The success of the stochastic-dominance tests and resulting sets led to thoughts of co-partial moments to effectively describe more than one security or portfolio. After reflecting on how partial moments parse the variance of a single security, the multivariate application became clear.
David had been working with co-lower partial moments as a method of addressing portfolio risk, but a full covariance partial moment representation had not been developed. By parsing the joint distribution of securities, I was able to define the covariance matrix with its corresponding co-partial-moment matrices. That definition opened up a fundamentally different way of viewing the relationship between variables.
Non-Linear Statistics
Many classical statistics are based on variance, or the covariance of variables. I realized I could redefine all of these techniques using the partial moments definition of variance and covariance. When exploring these techniques in more detail and reconstructing them, the pervasive linear assumption did not sit well. Upon investigating nonlinear relationships where classical methods failed, I noticed properties of the co-partial moments that seemed both interesting and relevant.
The first of these insights led to a new measure of correlation and dependence, which replicates linear instances while also capturing nonlinear relationships. From those partitions of covariance, the nonlinear regression method was born. This was nothing short of an epiphany and led to a flurry of statistical insights using partial moments, applicable to the nonlinear relationships that take place around us each and every day.
NNS
This is where another collaborator and major influence, Hrishikesh Vinod, entered. Hrishikesh took interest because of his own familiarity with partial moments. His career ran through Bell Labs alongside John Tukey and Peter Fishburn — names at the foundation of modern statistics and decision theory — which made him exactly the right person to pressure-test these insights with. His suggestion was simple: put these ideas, then living in Microsoft Excel, into an R package. Respecting his qualifications, I immediately began learning R and coding the framework into what became NNS.
With the ease of further experimentation that the R package brought, we were able to produce several papers on nonlinear regression and the partial-derivative insights the method generated. The package has continued to grow as I have found more associations and more techniques to which these underlying partial moment representations can be applied. One particular insight is the ability of the nonlinear regression to provide comparable results to many current machine learning methods.
See the growing list of examples using the NNS R package, including basic statistics, regression, machine learning, and time-series forecasting.
OVVO Labs
OVVO Labs is the applied expression of everything that followed — partial moments translated into production-grade tools for options pricing, portfolio construction, and macro forecasting. The mathematics stays under the hood. The output is available today.
This company exists to take a broader statistical foundation and express it through usable financial applications rather than leaving it trapped in papers, code, or theory alone.
The hedge fund that wanted my code “to make it better” has since been replaced by a newer assumption — that an AI can simply rebuild it. Both miss the same thing. The edge was never the code, and it was never a single formula. It was fifteen years of finding the right problem and building the framework that grew out of it. That is what OVVO Labs puts in your hands.
Please see our Media Page for interviews, instructional videos, downloadable slides, interactive AI reviews, and additional background on both NNS and OVVO Labs. The broader statistical language is open. The financial applications are available through OVVO Labs.